


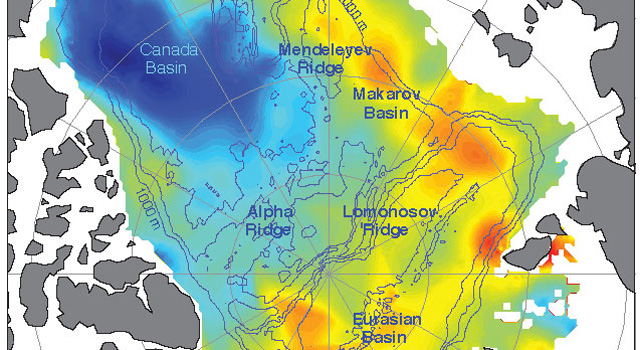
| Increasing freshwater on the U.S. and Canadian side of the Arctic from 2005 to 2008 is balanced by decreasing freshwater on the Russian side, so that on average the Arctic did not have more freshwater. Here blue represents maximum freshwater increases and the yellows and oranges represent maximum freshwater decreases. Credit: University of Washington | |
| 01.04.12 |
| By Alan Buis, Jet Propulsion Laboratory A new NASA and University of Washington study allays concerns that melting Arctic sea ice could be increasing the amount of freshwater in the Arctic enough to have an impact on the global "ocean conveyor belt" that redistributes heat around our planet. Lead author and oceanographer Jamie Morison of the University of Washington's Applied Physics Laboratory in Seattle, and his team, detected a previously unknown redistribution of freshwater during the past decade from the Eurasian half of the Arctic Ocean to the Canadian half. Yet despite the redistribution, they found no change in the net amount of freshwater in the Arctic that might signal a change in the conveyor belt. The team attributes the redistribution to an eastward shift in the path of Russian runoff through the Arctic Ocean, which is tied to an increase in the strength of the Northern Hemisphere's west-to-east atmospheric circulation, known as the Arctic Oscillation. The resulting counterclockwise winds changed the direction of ocean circulation, diverting upper-ocean freshwater from Russian rivers away from the Arctic's Eurasian Basin, between Russia and Greenland, to the Beaufort Sea in the Canada Basin bordered by the United States and Canada. The stronger Arctic Oscillation is associated with two decades of reduced atmospheric pressure over the Russian side of the Arctic. Results of the NASA- and National Science Foundation-funded study are published Jan. 5 in the journal Nature. Between 2003 and 2008, the resulting redistribution of freshwater was equivalent to adding 10 feet (3 meters) of freshwater over the central Beaufort Sea. The freshwater changes were seen between 2005 and 2008 by combining ocean bottom pressure, or mass, data from NASA's Gravity Recovery and Climate Experiment satellites with ocean height data from NASA's ICESat satellite. By calculating the difference between the two sets of measurements, the team was able to map changes in freshwater content over the entire Arctic Ocean, including regions where direct water sample measurements are not available. 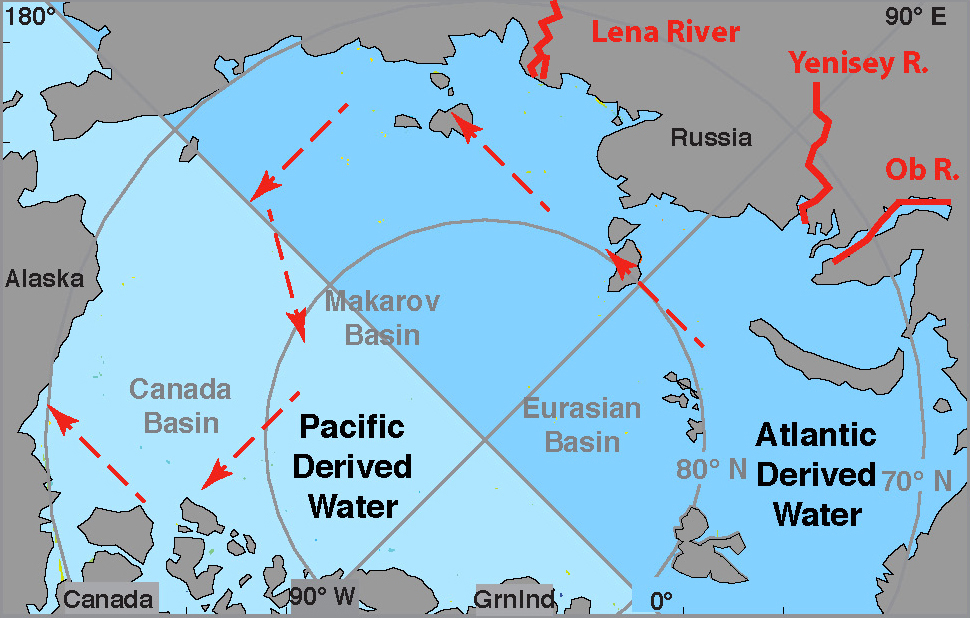 Red arrows show the new path of Russian river water into the Canada Basin. The previous freshwater pathway - across the Eurasian Basin toward Greenland and the Atlantic - was altered by atmospheric conditions created by the Arctic Oscillation. Credit: University of Washington "Changes in the volume and extent of Arctic sea ice in recent years have focused attention on melting ice," said co-author and senior research scientist Ron Kwok of NASA's Jet Propulsion Laboratory, Pasadena, Calif., which manages Grace for NASA. "The Grace and ICESat data allow us to now examine the impacts of widespread changes in ocean circulation." 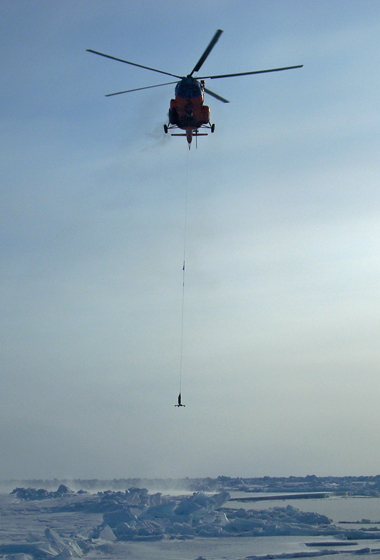 An instrument about to be dropped through an opening in the ice to the seafloor will record ocean bottom pressure to compare with similar data recorded by NASA's GRACE satellites. Data from GRACE, ICESat and actual water samples led to the discovery of a new pathway of freshwater in the Arctic. Credit: C. Peralta-Ferriz/UW Applied Physics Laboratory The Beaufort Sea stores more freshwater when an atmospheric pressure system called the Beaufort High strengthens, driving a counterclockwise wind pattern. Consequently, it has been argued that the primary cause of freshening is a strengthening of the Beaufort High, but salinity began to decline early in the 1990s, when the Beaufort High relaxed and the counterclockwise Arctic Oscillation pattern increased. "We discovered a pathway that allows Russian river runoff to feed the Beaufort gyre," Kwok said. "The Beaufort High is important, but so are the hemispheric-scale effects of the Arctic Oscillation." "To better understand climate-related changes in sea ice and the Arctic overall, climate models need to more accurately represent the Arctic Oscillation's low pressure and counterclockwise circulation on the Russian side of the Arctic Ocean," Morison added. |


